Dust Emission Image and Catalogue Parameters
 |
 |
 |
Notes
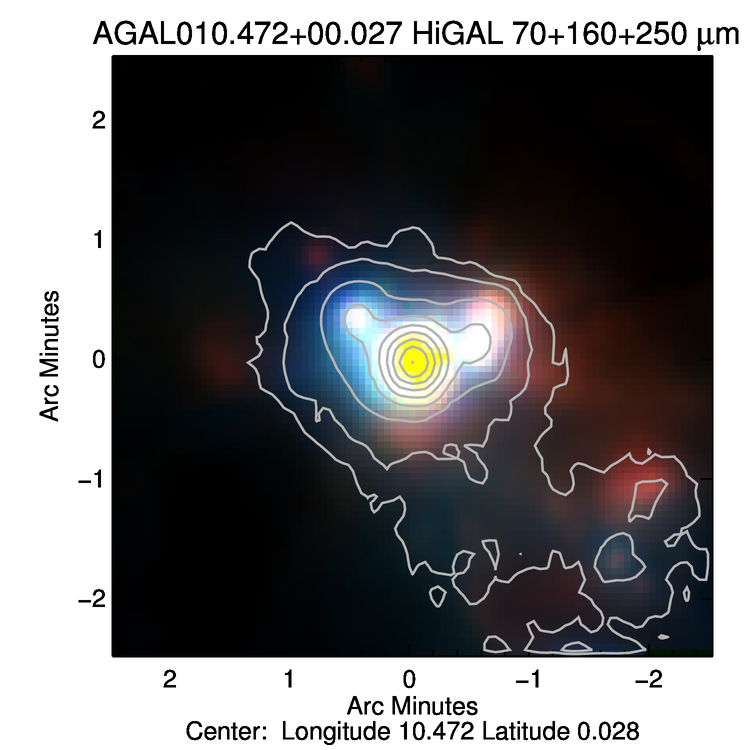
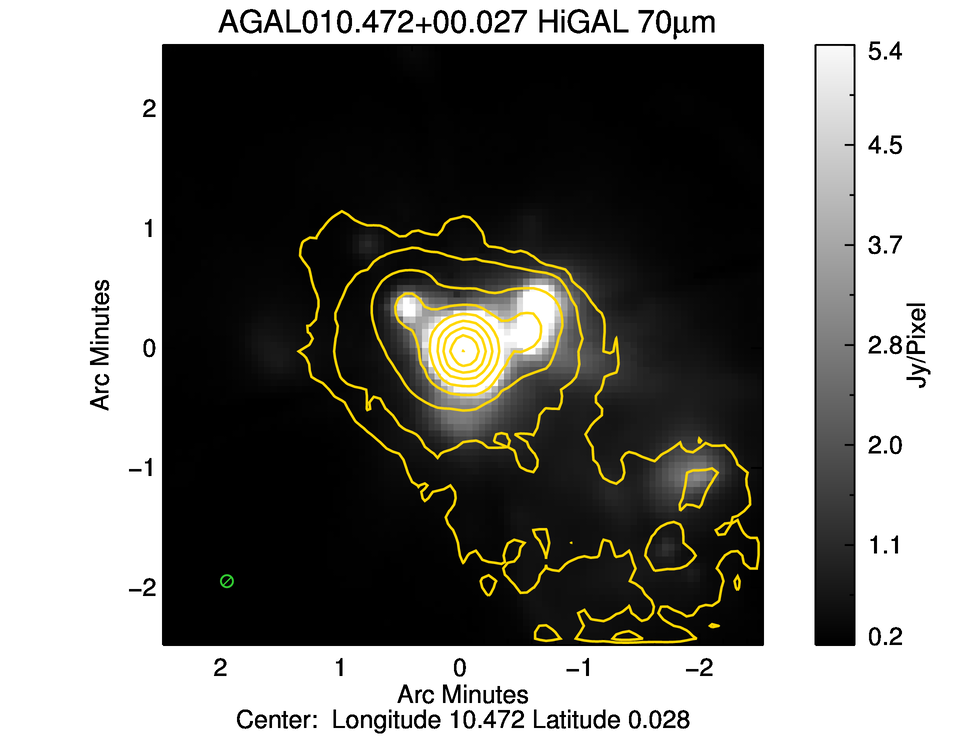
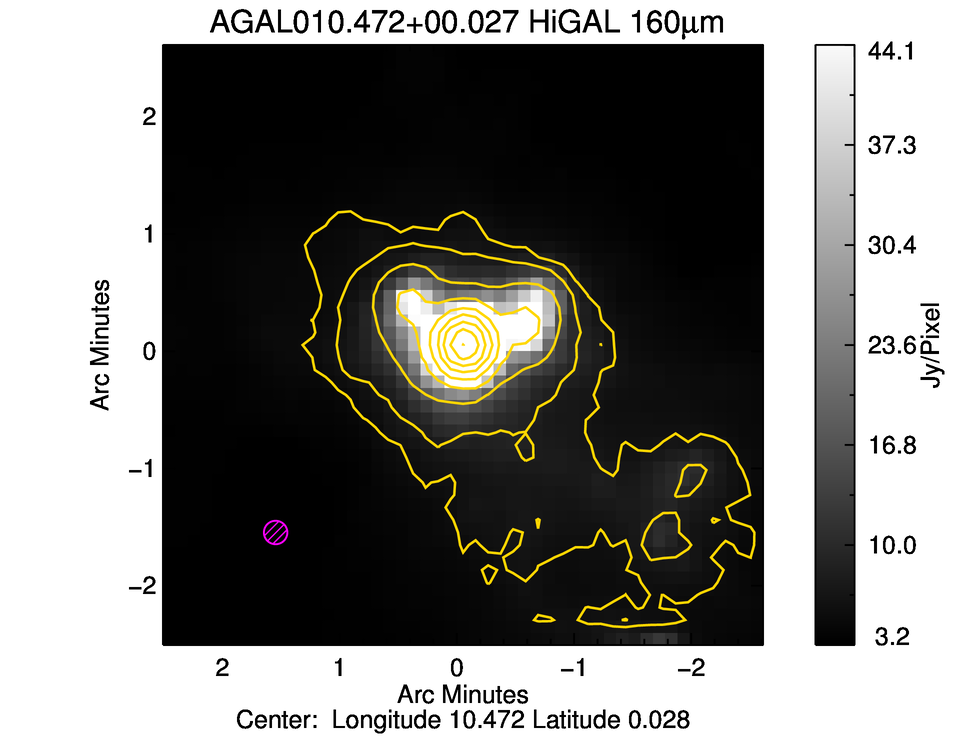
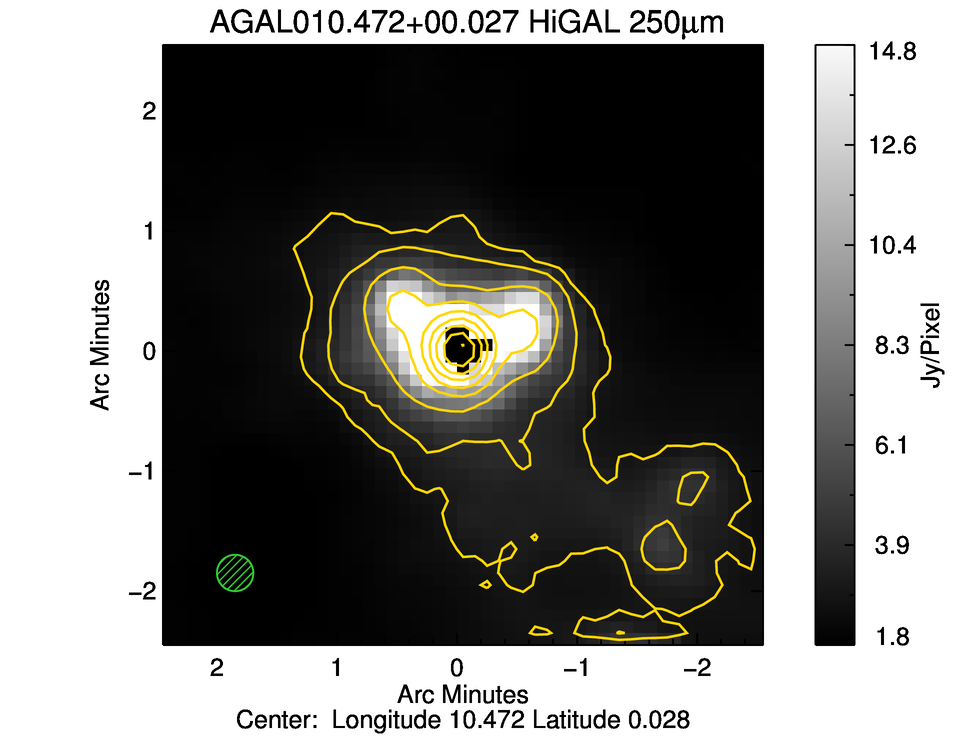
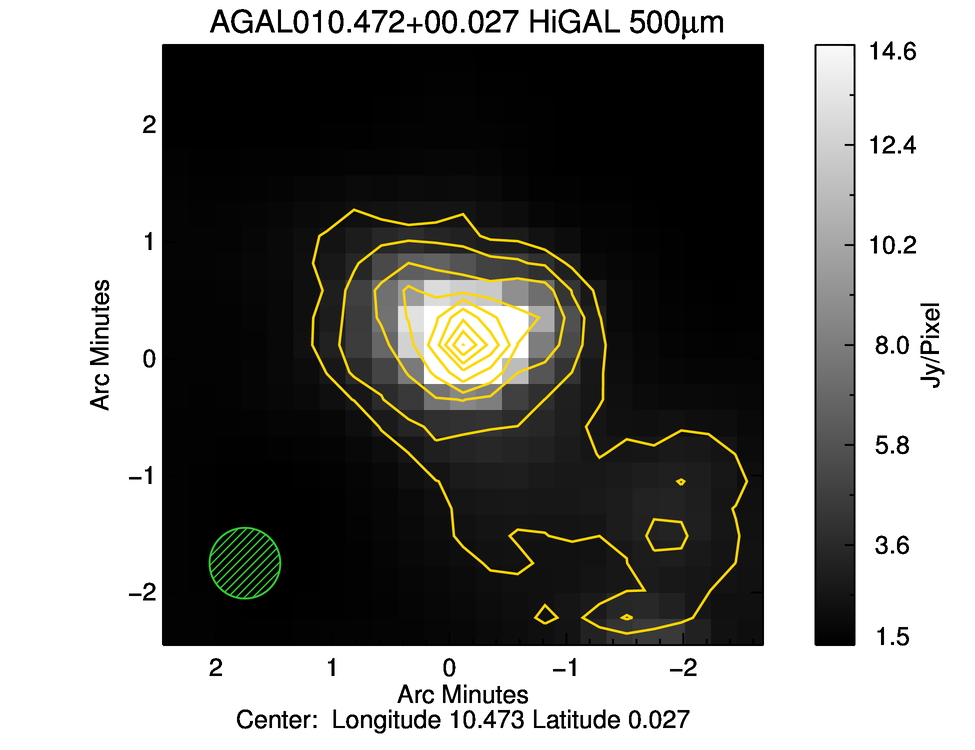
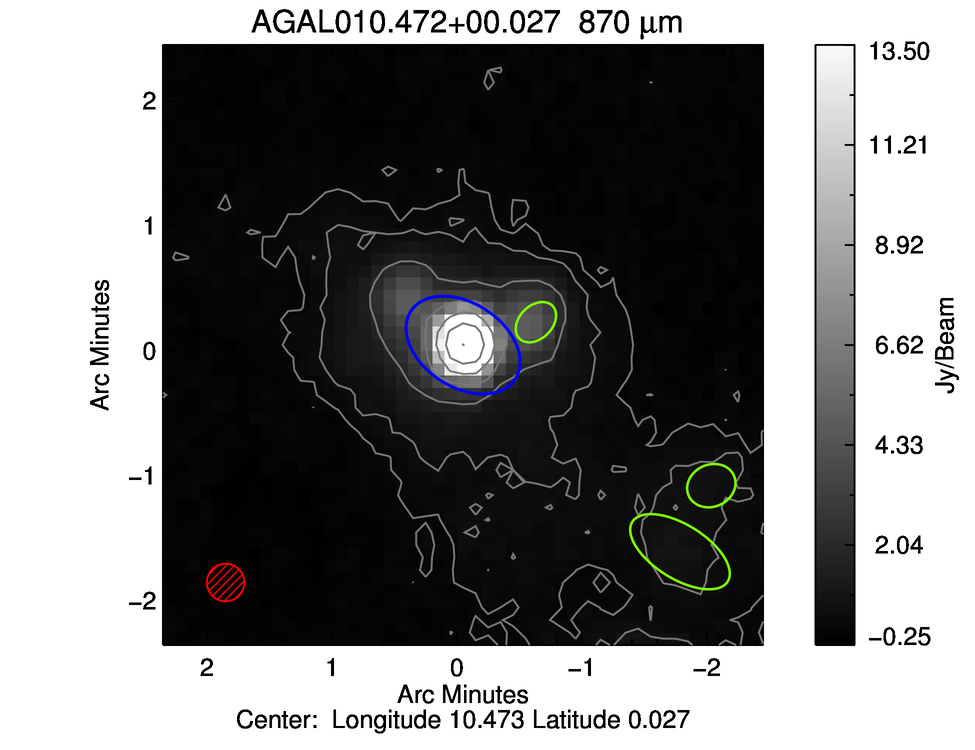
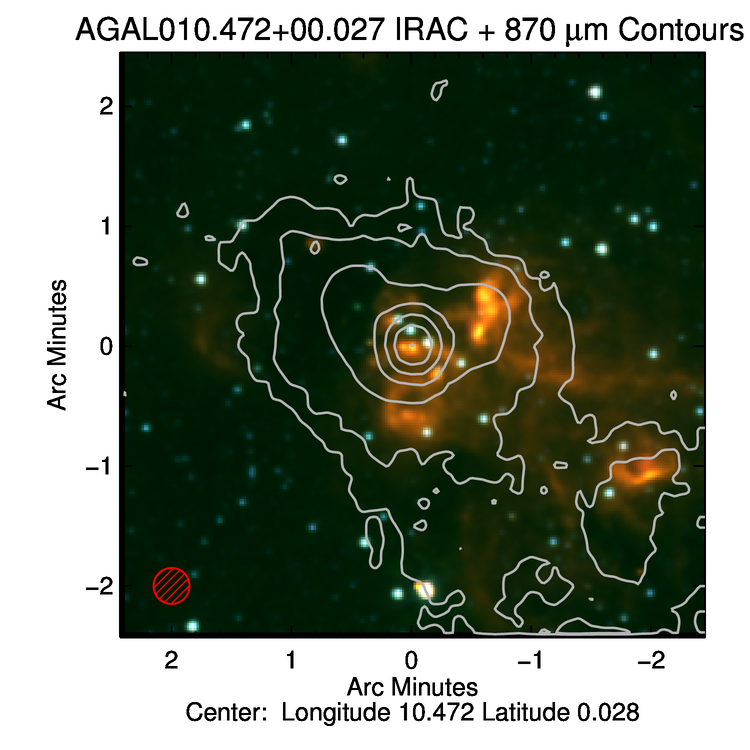
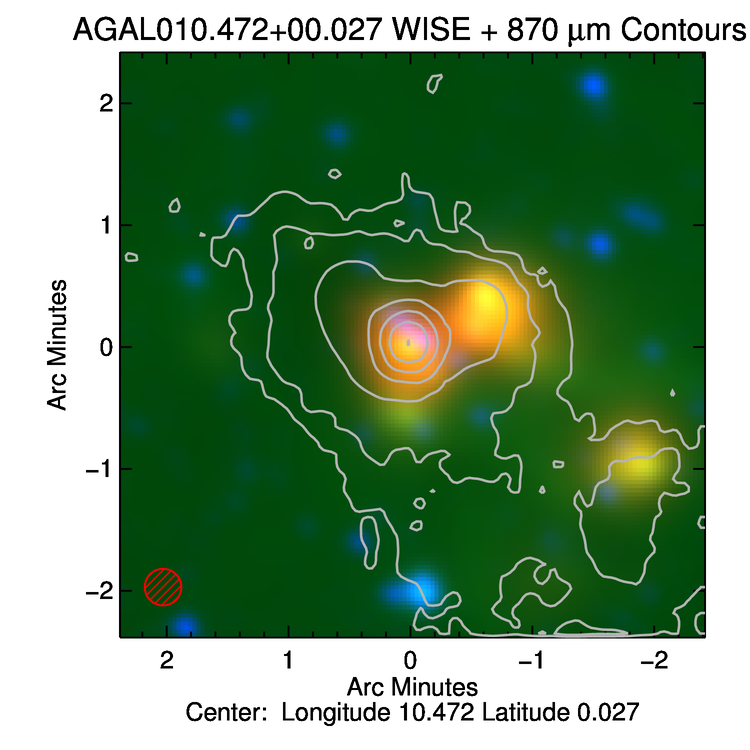
The image presented in the left panel is a 5x5 arcmin region extracted from the ATLASGAL tiles and is centred on the position of the peak flux associated with the source. The source size and orientation is shown by the blue ellipse, while the sizes and orientations of any other detected sources located in the field are shown in green. The contours shown in grey start at 3 sigma and increase in steps determined by a dynamic power law (see Thompson et al. 2006 for details). The angular resolution of the ATLASGAL survey is indicated by the hatched red circle shown in the lower left corner. In the middle and right panels we present a three colour mid-infrared image created using the 4.5, 5.8 and 8 μm IRAC band filters extracted from the GLIMPSE Legacy Project, and the 4.6, 12 and 22 μm WISE bands. Contours show the distribution of the dust with respect to the infrared emission (contour levels are the same as shown in the left panel). The white hatched circle shown in the lower left corner of this image again indicates the resolution of the ATLASGAL survey.
| Cat. Id | Source Name | RA | Dec | Eff. Radiusa | Peak Flux | Int. Flux | Detectionb | Dust Temp. | VLSR | Distance | Mass | Luminosity | Classification | Catalogue |
|---|---|---|---|---|---|---|---|---|---|---|---|---|---|---|
| (J2000) | (J2000) | ('') | (Jy beam-1) | (Jy) | Flag | (K) | (km s-1) | (kpc) | (log[Msun]) | (log[Lsun]) | Reference | |||
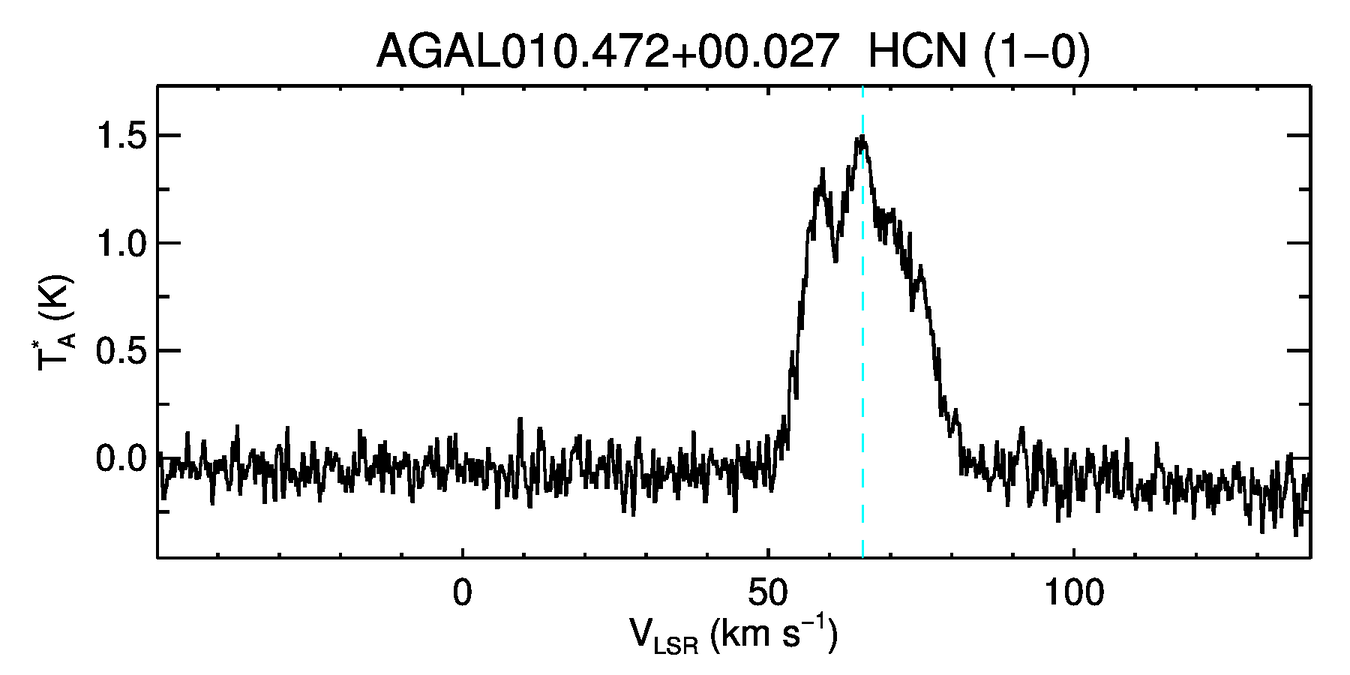
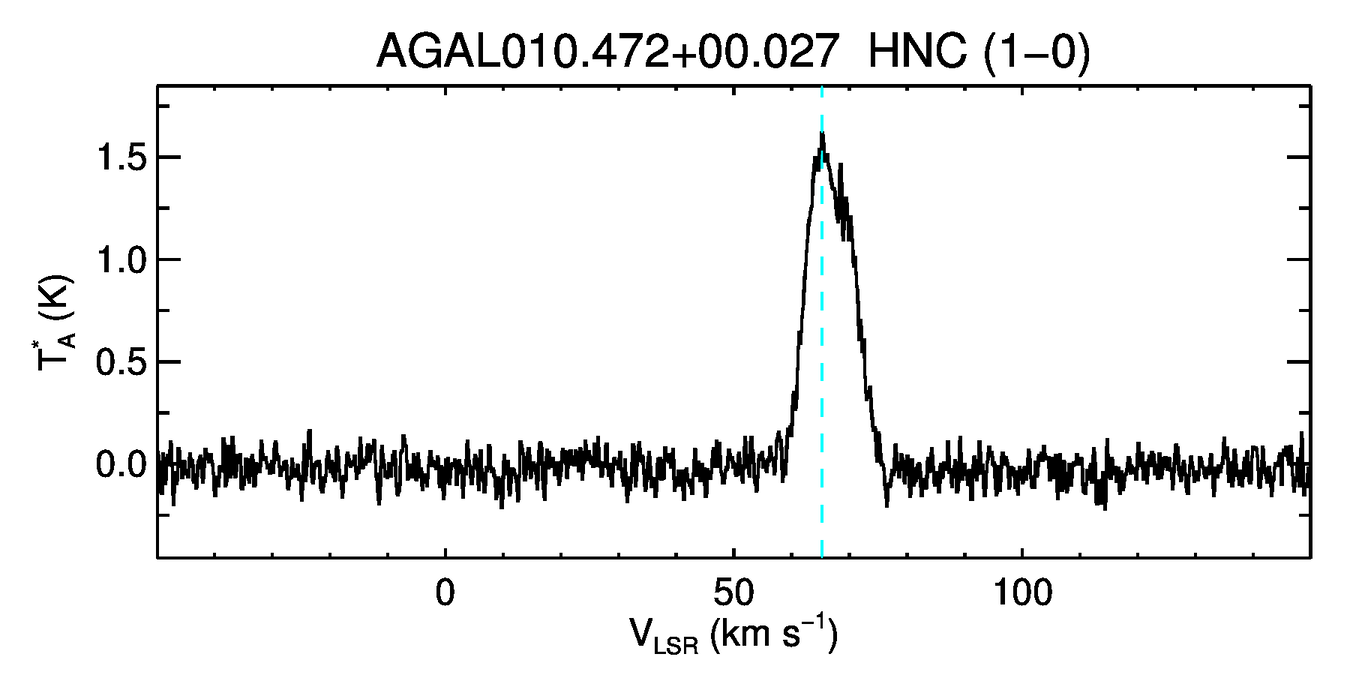
| 7691 | AGAL010.472+00.027 | 18:08:38.18 | -19:51:49.0 | 56 | 35.01 | 88.12 | 2 | 25.1 | 67.1 | 8.5 | 5.646 | 4.406 | HII region (Radio) | Contreras et al. (2013) |
Useful Linksc
Footnotes
a) The effective radius is estimated from the geometric mean of the deconvolved major and minor axes and multiplied by a factor of 2.4 that relates the ms size of the emission distribution of the source to its angular radius (Eqn. 6 of Rosolowsky et al. 2010). As the sizes are determined for the emission above 3 times the local background noise the major and minor axes can be smaller than the beam for some of the weaker sources and in these cases a value of -1 is returned for this field.
b) This flag is
either zero (no particular problem), or is equal to the sum of one or
more number(s) with the following meanings: (1) the object has
neighbours, bright and close enough to significantly bias the
photometry, or bad pixels (more than 10% of the integrated area
affected); (2) the object was originally blended with another one; (4)
at least one pixel of the object is saturated (or very close to); (8)
the object is truncated (too close to an image boundary); (16)
object's aperture data are incomplete or corrupted; (32) object's
isophotal data are incomplete or corrupted; (64) a memory overflow
occurred during deblending; (128) a memory overflow occurred during
extraction. For example, a flag value of 10 means that the object was
originally blended with another source
c) The size of the semi-major axis is used to search for associations with the following links.